|
In analyzing a 2D NMR plot, the inherent symmetry of the experiment may be used to help distinguish between real peaks from the molecule and peaks due to instrumental interferences. Homonuclear correlated spectra are symmetric with respect to the diagonal line corresponding to y = x. That is, an actual peak due to the analyte will have a matching peak on the other side of the diagonal. Most interference peaks (or "artifacts" as they are sometimes called) do not exist in symmetric pairs (Bruch 157).
Two-dimensional homonuclear correlated NMR spectroscopy (COSY) produces spectra in which proton chemical shifts are correlated with each other along both frequency axes (Friebolin 248). A 2D COSY experiment may be used to map the homonuclear J-coupling network in a molecule. Two 90-degree pulse sequences are used in the process (Bruch 161).
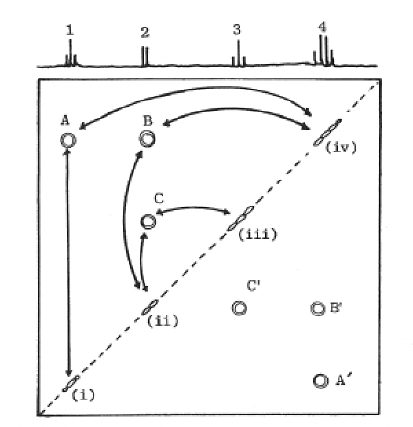
COSY spectra are in the form of a two-dimensional contour plot. An advantage of the COSY spectrum is that all of the coupling interactions can be determined using a single two-dimensional plot. Contours lying along the 45-degree diagonal of the plot represent peaks that normally appear in the 1D NMR spectrum. Contours in areas other than this line show coupling interactions between the protons. To determine which protons are coupled, two lines are drawn at 90-degrees to each other, starting at the contour cross-peak and ending at the diagonal. The locations on the diagonal where the two drawn lines intersect correspond to the chemical shifts of the two coupled nuclei (Atta-ur-Rahman 271).
|
| An example of a COSY spectrum |

|
| Atta-ur-Rahman. Nuclear Magnetic Resonance: Basic Principles. 1986. |
Based on this spectrum, the protons at (i) (the triplet) are coupled with the protons at (iv) (the quartet), and the protons ar (ii) (doublet) are coupled to those at (iii) (triplet) and (iv) (Atta-ur-Rahman 271). When a proton is coupled to more than one neighboring proton, the diagonal peak forms the corner of several squares (Friebolin 250).
In a COSY spectrum, the top portion of the diagonal line (upper right side) represents the upfield region, while the lower left portion represents the downfield region (Atta-ur-Rahman 271). The terms "upfield" and "downfield" are used to represent regions in terms of distance from the reference, TMS. When a multiplet consisting of m lines is coupled to a n-line multiplet, the resulting COSY peaks are composed of m x n lines of alternating positive and negative intensities. The space between the lines is determined by the coupling constants linked to each multiplet (Bruch 190).
An important consideration when performing a 2D NMR experiment is that in order to make line assignments based on a COSY spectrum, the chemical shift of at least one proton in the molecule must be known. This proton then serves as a starting point for the assignment of protons that are coupled to it (Friebolin 251-254).
|

